
Advanced Call Reporting, Analytics and Dashboards
- Call Analytics and Dashboards
- Drive Customer Engagement
- Contact Centre Analytics
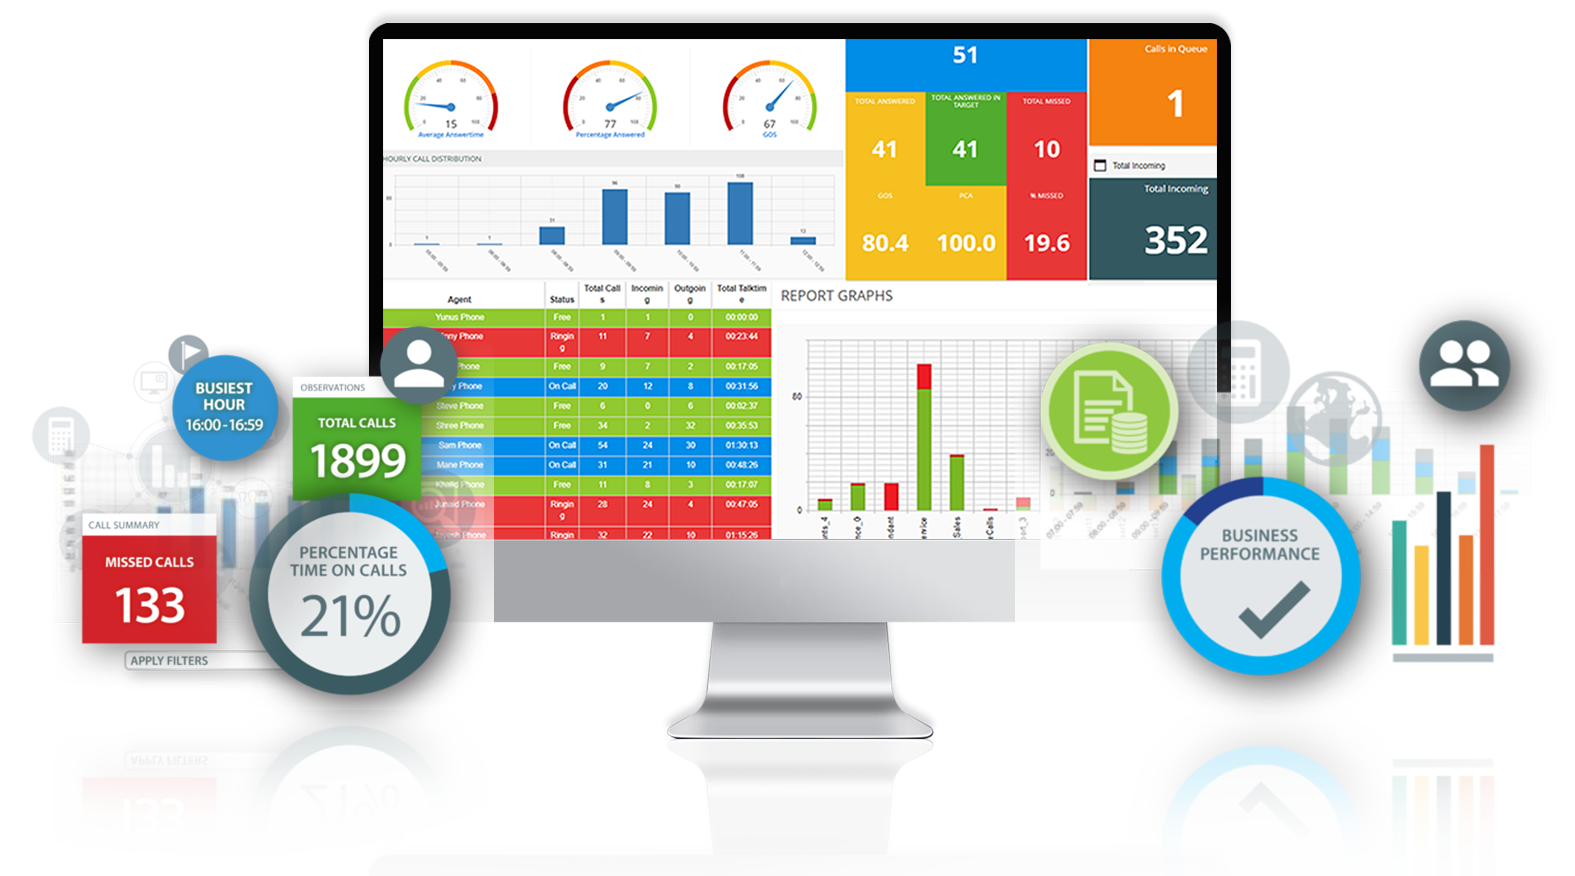
In-Depth Reporting, Live Analytics & Dashboards
iCall Suite incorporates consistently with cloud and on-premise telephone frameworks to convey constant examination. Organizations can screen call measurements basic to their business by getting to constant reports, 'snap and drill' dashboards, wallboards and call accounts.
iCall Suite is demonstrated to recognize business efficiencies that convey a profit from your telecoms speculation. Settle on informed choices on framework, office and client call movement to convey a more powerful support of your clients.
iCall Suite business reporting solutions cover 3 key areas:
- At a Glance Business Insight: Intuitive business usefulness instrument to screen inbound and outbound calls
- In-Depth Call Reporting: Enhanced call revealing including configurable wallboards and itemized call examination
- Live Call Analytics: Powerful live call investigation to screen gatherings, call lines and oversee client confronting groups

Powerful Insight
iCall Suite is a comprehensive, simple-to-use, fully integrated call analytics solution that helps organisations improve customers' satisfaction and experience. Make quick judgments about call activity, improve customer service by tracking unanswered missed calls, caller tolerance, and service grade, and manage resources by detecting busy call periods.

Retain Customers
Improve Customer Service
Increase Sales
Monitor Performance and Return Missed Calls
Meet SLAs
Continual Improvement of Call Handling
Reduce Costs
More Informed Decision-Making
Key Call Metrics At a Glance
For corporate productivity, the Business Insight dashboard and wallboard provide intuitive call data visualisation. To keep track of inbound and outbound calls, the at-a-glance console provides graphs and tabular data.
Essential KPI Dashboard
Analyse Business Performance Data
Data Visualisation
Monitor DDI / Extension / User Metrics
Business Wallboard
Share Key Business Metrics On-Screen
In-Depth Call Analytics, Dashboards and Wallboards
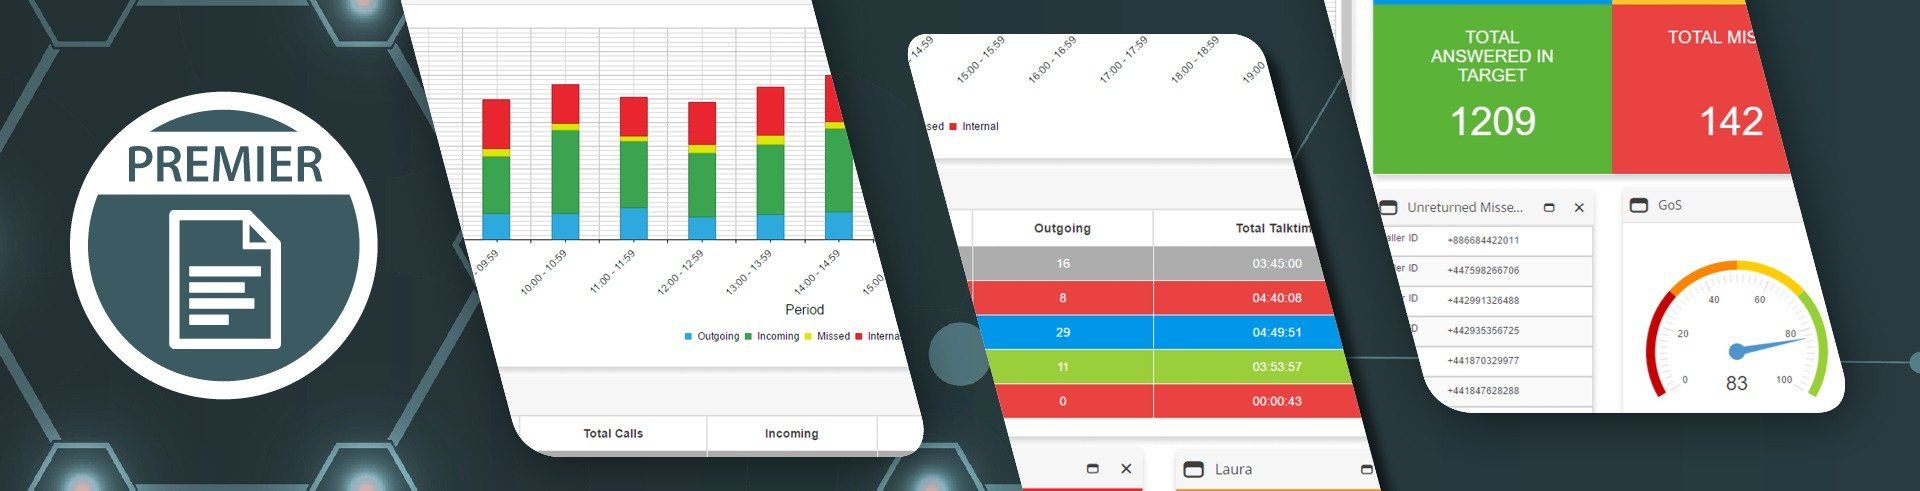
An large portfolio of pre-configured reports, bespoke reporting, graphical dashboards, and visual wallboards is available with enhanced level real-time and historical reporting.
Flexible Reporting
A large number of customisable reports are available to help you spot performance trends.
Call activity is reported by extension, department, DDI, and user.
Incoming Call Analytics
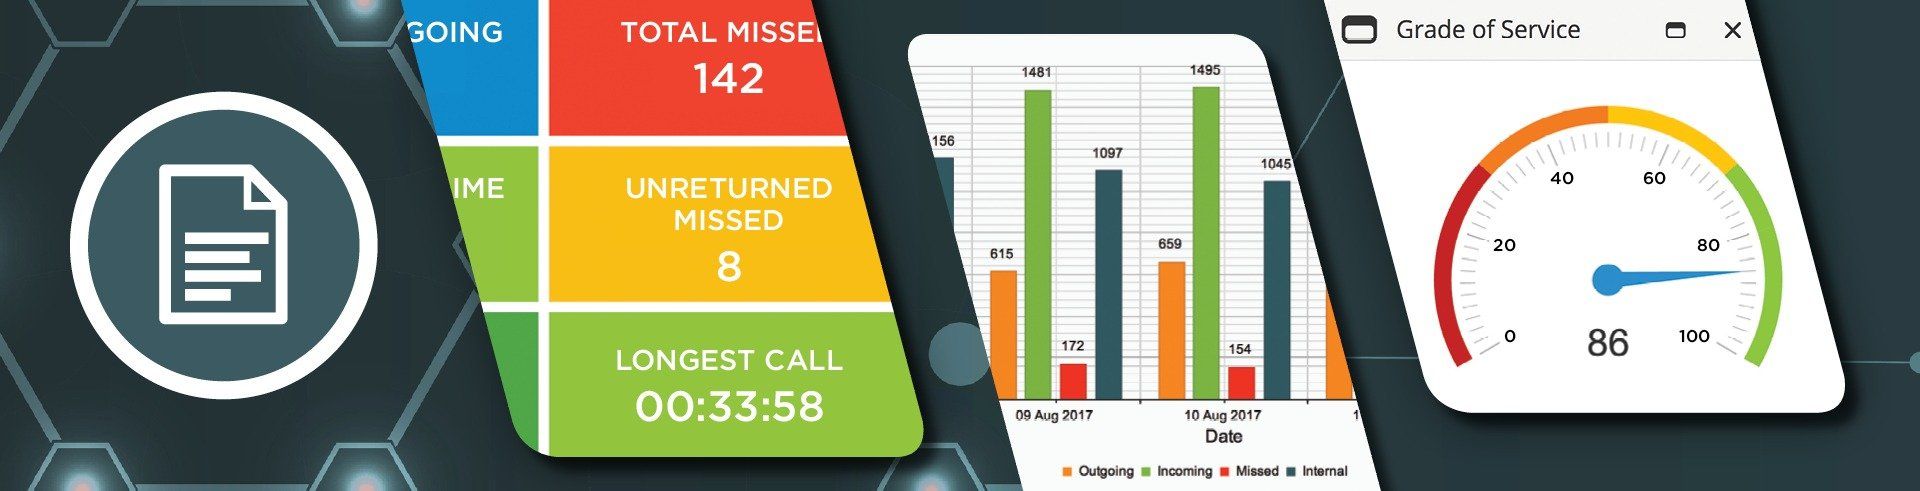
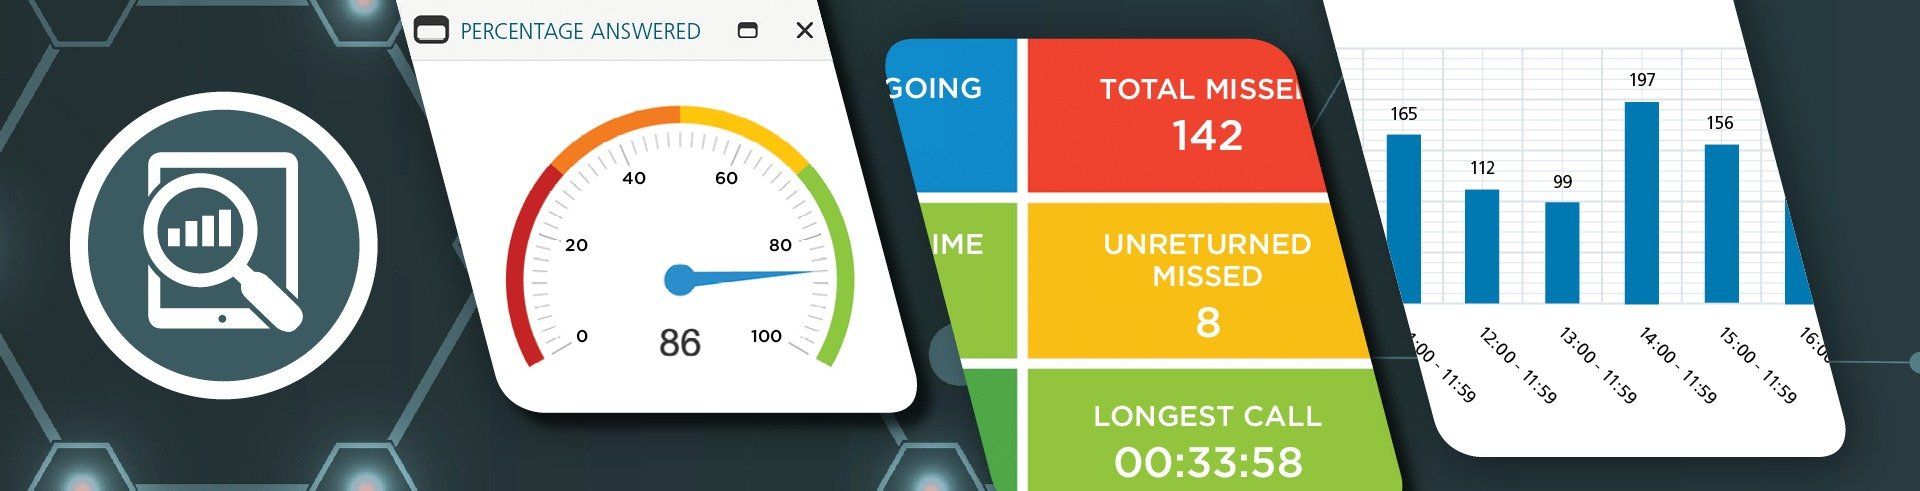
Call volume, targets, Grade of Service (GoS), Percentage Call Answered (PCA), caller tolerance (wait time), and unreturned missed calls are all things to keep track of.
Unreturned Missed Calls
Calls that have been missed but not returned are counted.
This report can be used as a tile on a wall.
Executive Summary
Executive reports compile critical information from a variety of reports to provide observations and recommendations for corporate activities.
Dashboards
Data that has been pre-defined or filtered is displayed in tabular or graphical formats on live tiles.
Wallboards
Key call metrics should be visually displayed on live tiles in a way that can be shared on a screen or desktop.
Live Call Analytics, Dashboards and Wallboards
To manage customer-facing employees, meet SLAs, and commitment targets, keep an eye on real-time statistics.
Live Call Reporting
Hunt groups, call queues, incoming calls on users, and crucial metrics like GoS, PCA, and caller tolerance are all monitored.
Essential Team Statistics
Call queue parameters are displayed in real time on group wallboards using team dashboards and wallboards.
Wallboards
Real-time measurements are shown on pre-configured and customised wallboards.
For customer-facing staff, get real-time call and queue statistics.
Monitor Live Calls & Queues
Metrics on active calls, time in current status, average queue time, wait time, and call duration are available.
Group View Wallboard
View the status of agents to get a sense of how much personnel is available at any given time.
Live Analytics on Users
Examine real-time user analytics, such as time logged in, quantity and length of inbound and outgoing calls, and availability.
Drive Staff Performance

Monitor Individual Performance
Individuals and agents should be empowered with dashboards, reports, and wallboards so they can take charge of their own call activity performance.
Individuals and agents are motivated by clearly provided, meaningful user performance KPIs, which allow them to track their progress against personal and departmental goals.
- How many phone calls have you made thus far?
- During the day, how much time do you spend talking?
- How long does it take you to respond to a phone call?
- How many missed calls have you returned?
- Which calls should be clarified or flagged for follow-up?
Managers may detect knowledge training gaps, understand and assist individual team members, and champion high performers to help others replicate their success.
Improve the customer experience by engaging employees and identifying areas for improvement.
Improve Team Operations
To keep teams on track and focused on success, share group performance dashboards, team wallboards, and trend reports.
Employees, processes, training, and call flows are all areas that managers can improve. Within and between departments, team performance can be analysed to see what makes your team effective.
- What do people do with their free time?
- Are they dialling the correct numbers?
- Are they overworked or underworked?
- Are there any hunt groups, auto attendants, or lines that are ineffective?
- Will anyone be monitored to see if they can enhance their performance?
Using trend, call back, and call journey information, best practises may be shared and teams compared.


Drive Supervisor and Agent Productivity
Keep customer-facing personnel focused on the customer experience by reviewing real-time contact centre statistics.
Supervisors can evaluate agent performance and resourcing in relation to the company's key performance indicators (KPIs). Live calls and KPI summaries by contact group are displayed in a dedicated workspace in accordance with aims. Management is simplified by the ability to control breaks, broadcast messages, and communicate with agents. Supervisors can also anticipate agent needs in order to optimise resource allocation and maintain high levels of customer service.
- How many phone calls go unanswered?
- How many of such calls receive a response?
- What is the cost of a missed call that is not returned?
- Are you aware of your busy hours on a team-by-team basis?
- Is it possible to streamline the call journey so that it takes less time and involves fewer people?
Agents can easily handle calls using a dedicated agent console, which allows them to identify VIP contacts, transfer, hold, callback, receive callback notifications, and plan calls.
The use of a script ensures consistency in call handling, which improves the customer experience.
Maximise Customer Experience
Meet Customer SLAs
Exceed customer expectations, satisfy customer SLAs, and maximise customer experience to set your company apart from the competition.
- Are your consumers happy with the service they get from your company?
- Was the path to the call handler straightforward or winding?
- How frequently are issues handled on the first contact?
Examine and comprehend their consumer journey in order to spot trends and avoid losing opportunities.


Drive Business Performance
To improve business performance, identify business trends, highlight challenges, and disseminate insights with the right people at the right time.
To evaluate important performance data over time, discover abnormalities immediately, and understand underlying business difficulties, access historical trend reports. Maintain a laser-like focus on the high-level metrics that matter to groups, departments, and the entire company.
Consolidated business summaries and business performance dashboards make it simple for leaders across the organisation — not just those in charge of customer-facing teams – to find and share the most critical data.


